No Results Found
The page you requested could not be found. Try refining your search, or use the navigation above to locate the post.
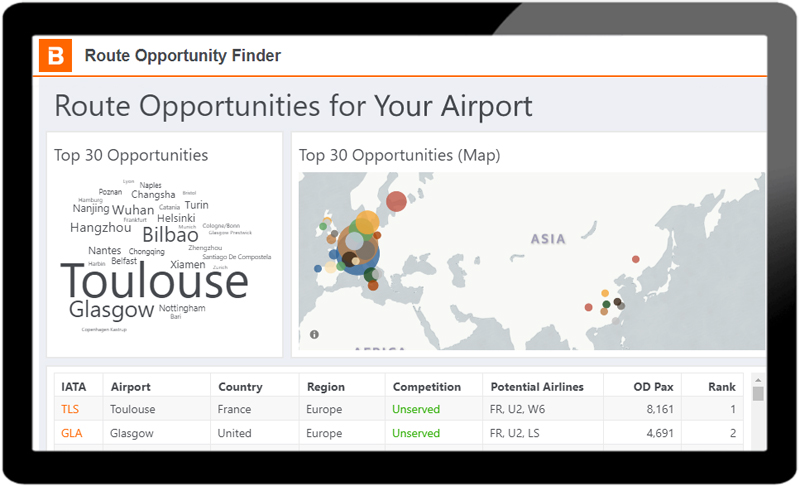
Research conducted by BEONTRA reveals that more than half of all newly introduced routes have an origin-destination (OD) market size below 1,000 passengers prior to the opening. This finding proves that the common approach to use OD demand data to identify potential new routes, is not effective for a large number of markets. Following discussions with analysts from leading airlines, BEONTRA has developed a method which takes the bigger picture into account. It will be available as a new feature in the B Route Development solution in March 2020.
Unserved short-haul markets often lack substantial existing traffic
OD market data are widely accepted by airports and airlines and play to their strengths in the analysis of established markets or large unserved markets. However, especially for short-haul destinations and emerging markets, the current market size on unserved routes is often too small to be a meaningful indicator for the viability of a non-stop service.
Many point-to-point airlines rely on route benchmarking
Due to the limited significance of OD data, airlines specialized in point-to-point services, such as low-cost carriers, often take their decisions based on a benchmark of routes. From their revenue management system, they know which of their existing routes are most profitable and they look out for potential markets with similar characteristics. Besides traffic data, the most frequently examined criteria are competition and catchment demography.
New BEONTRA feature ranks opportunities and proposes potential carriers
To enable airport route development teams to objectively judge market opportunities, BEONTRA is introducing a new feature to its route development solution. The “Route Opportunity Finder” automates route benchmarking and creates a ranking of potential new air services. The algorithm analyzes more than 50,000 actual airlines routes, which have been introduced in the past 10 years, and compares them against the characteristics of potential new destinations for your airport. Criteria used include traffic structure and competition as well as demographic data, such as catchment population and GDP.
The resulting ranking of promising routes reflects the airlines’ preferences derived from their market activity. Also, a recommendation of potential carriers, which could serve the route is provided. This amazing feature does not only save you time, but also eliminates your blind spot and makes you aware of markets which you might not have thought of.
About B Route Development
With this new feature, BEONTRA’s B Route Development product covers the full scope from the discovery of route opportunities to the creation and presentation of fully-fledged airline business cases. More than 30 airports world-wide put their trust in B Route Development, which is built on industry standard data sources, such as Sabre Global Demand Data, flight schedules and airline unit cost information. Find out more about B Route Development.
Interested? Contact us today for a free demo
The page you requested could not be found. Try refining your search, or use the navigation above to locate the post.

Last week BEONTRA attended the “Digitally Connected Airports Conference” hosted by Eurocontrol & ACI in Brussels. At this well-organized event, the European aviation community discussed the trends & challenges imposed on the industry in order to meet the future capacity demand.
With an expected growth of 48% in 2040, the slot-constrained aviation system is under extreme pressure to increase capacity. The growing consciousness around climate change and the EU green deal that was officially presented yesterday force airports to only consider expansion plans that do not have a negative impact on the environment.
Key take-aways the audience was briefed on to master this challenge were:
BEONTRA contributes to these take-aways and is committed to the overall challenge of increasing capacity in a sustainable manner. Over the next months, we will fast-track and evaluate several ideas raised by our internal innovation platform process. Whether it affects your budget forecast, terminal capacity management scenarios or strategic development plan, BEONTRA will provide you with the transparency required to take sound and aligned decisions.
Contact us or request a free demo to find out more about how BEONTRA can support your airport.

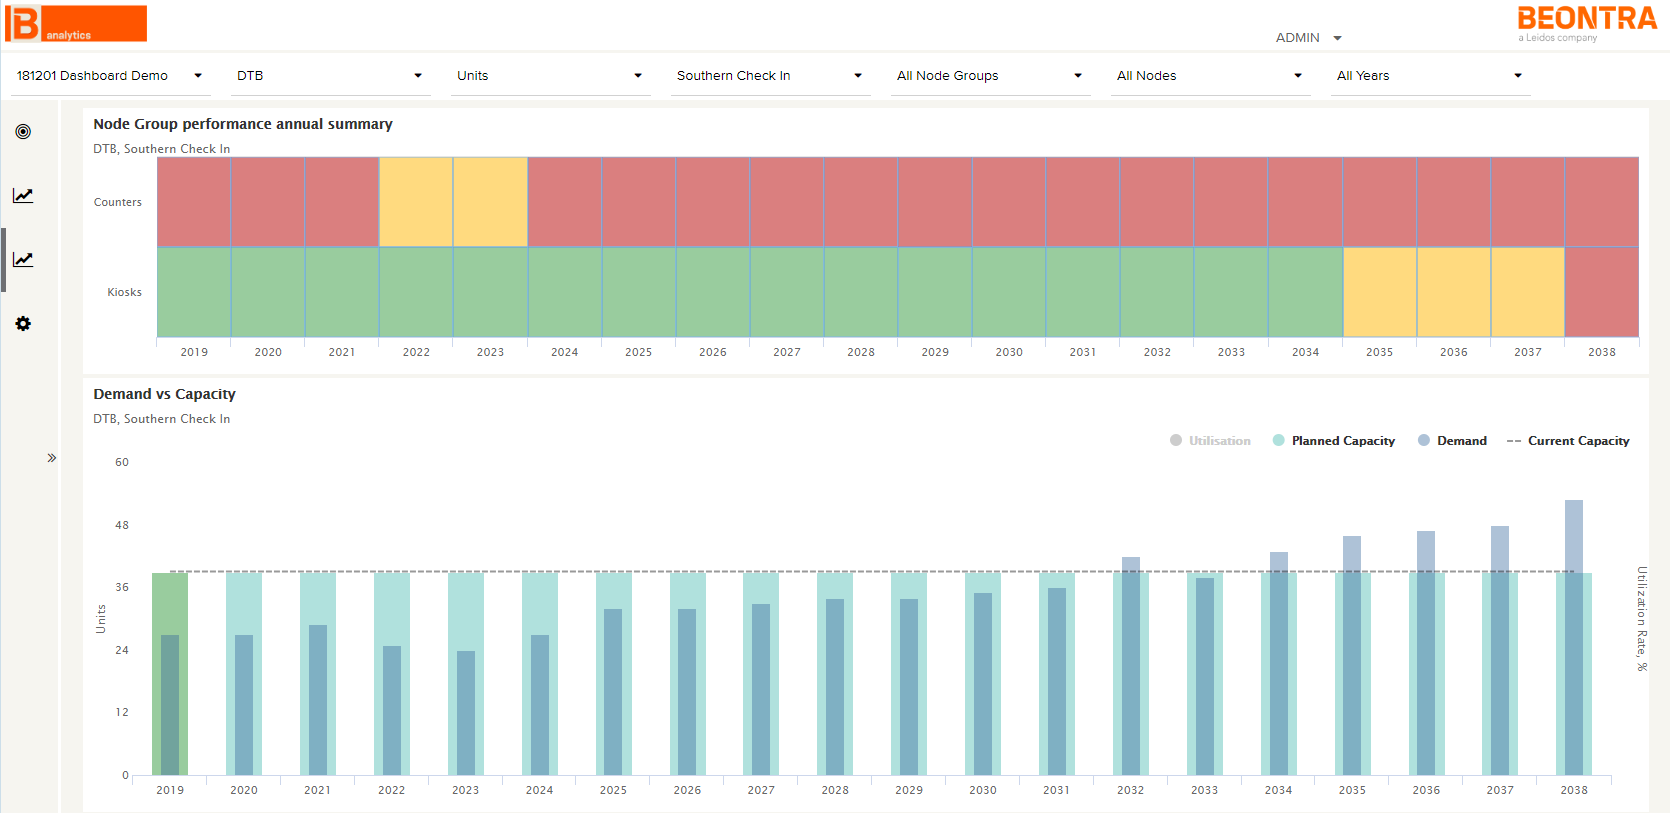
Airports are going to run out of capacity due to the phenomenal growth of the aviation industry. We are confronted with this constantly. Still, the question remains: what can your organization do to meet the rising demand in the best way? BEONTRA can support you to identify the biggest capacity constraints right now, how the situation evolves in the future and how you can react to it in order to deliver excellence to your passengers in the most efficient way. This is where the new Capacity Demand Dashboard comes into play: it supports you to make better CAPEX investment decisions and to provide argumentation for strategic airport development decisions.
The two main input parameters are future (design day) schedules on the one hand and the airport’s infrastructure on the other hand. Either full seasons or peak day schedules can be utilized. Design days (usually 8th, 15th or 20th busiest days for a future season, or IATA defines the design day as the 2nd busiest day in an average week during the peak month) for each year are the most common option. The airport’s infrastructure includes current infrastructure, construction work schedule (and related down time of infrastructure) and future expansions.
BEONTRA combines software applications for forecasting and planning in the aviation industry with years of experience and gathered know-how and best practices in order to build products that support your journey to excellence and efficiency.
After having successfully conducted multiple projects in the field of capacity planning and engaged with our user community over multiple years, we have decided to complement the existing solutions by adding new functionality to successfully execute capacity studies and provide the decision support to make substantiated infrastructure investment decisions. This has been accomplished with the Capacity Demand Dashboard.
The Capacity Demand Dashboard is summarizing the relationship of the demand for your infrastructure and its capacity for up to 20 years. It enables you to identify when you are going to run out of capacity and when it is time to expand which part of the infrastructure. The Capacity Demand Dashboard delivers the results in a straightforward manner that is suitable to be presented to the decision makers, upper management and other relevant stakeholders. Colour coding aids interpretation of complex data results.
If you want to know more about this topic, please contact us.

A first version of an interface has been finalized that allows the usage of show up profiles for each individual flight. Besides the higher level of detail that can now be covered resulting in more accuracy of your Security Forecast, a huge advantage of the interface is the automation of updates of your show up profiles which results in more accurate security forecasts.
The frequent availability of boarding card scan data or other data sets on single flight level was the main driver and basis for the development of this feature.
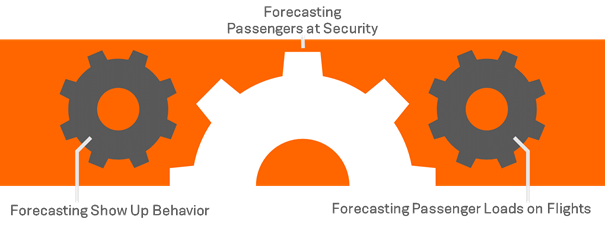
BEONTRA’s passenger flow simulation tool Terminal Capacity within B Capacity has been used to forecast passenger numbers at security for many years now. Together, the BEONTRA community has always driven the improvements in the accuracy of these forecasts. First and foremost, the underlying flight by flight passenger load forecast is of course the most crucial element. However, the terminal model with all its parameters and hence the accurately modelled passenger flows plays an equally important role to get the expected passenger numbers for each specific security check area over the day right.
One of the key elements of this model and a main driver for accuracy are the show up profiles – for the non-Terminal Capacity experts, these describe how and when originating departure passengers show up to the airport before their flight:
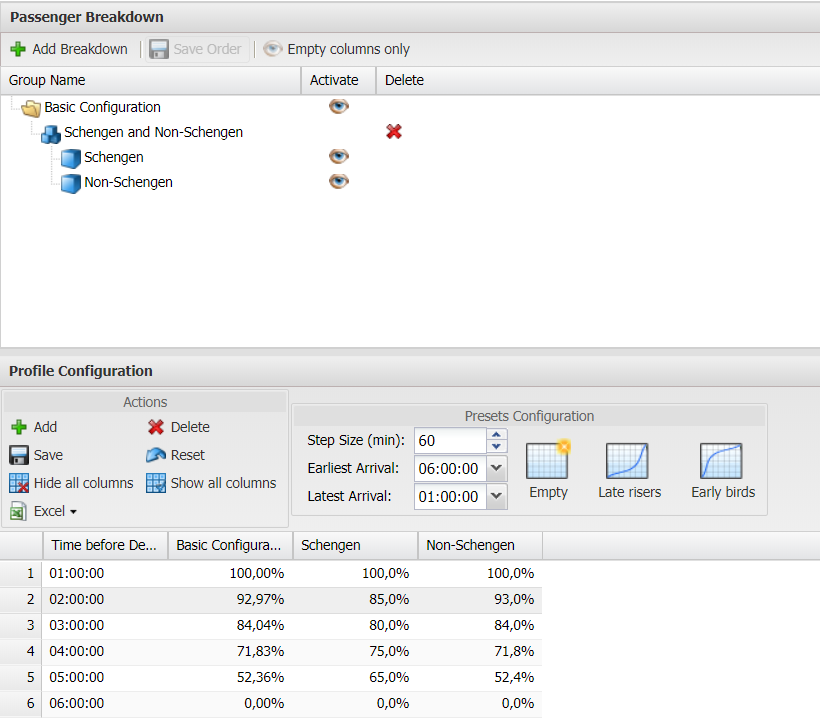
Above, it is shown how show up profiles are being defined in the system. This approach is still working very well and achieving very good results, especially when data availability is not ideal.
However, the fact that boarding card scanner data and other comprehensive data sets covering the show up behavior of passenger become available more and more readily drove the development of this new interface, which enables the system to read show up profiles for each individual day and flight. These detailed show up profiles are then used as the primary source for show up profiles. Should any flight not be covered, the profiles in the system will work as a fallback. As a result, two major improvements result in a more accurate Security Forecast for your airport. On the one hand, the more granular level of show up profiles is (based on the right data) per definition an accuracy gain. On the other hand, and equally important is the possibility to automatically update the profiles.
Using these external show up profiles (external because they are not provided by the user in the system, but automatically extracted from measurement data) is as simple as checking a box (please see screen shot below).
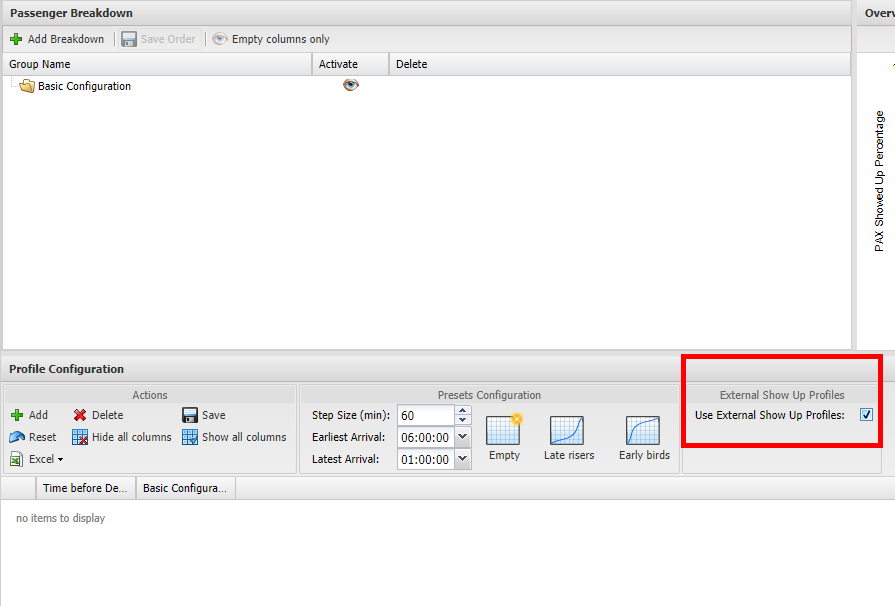
The prerequisite for show up profiles on a single flight level is a comprehensive data set and data source. The most prominent one is boarding card scans. This data is the source for deriving the show up profiles. On top of this, source algorithms can be applied to find similarities and patterns. We are currently conducting research on applying machine learning on top of the boarding card scan data to derive show up profiles. Once results are available, we will be sharing these and complete our offer regarding show up profiles on a single flight level.
The interface we build is a standard interface which enables any 3rd party application to connect to it. That means if your airport is already experimenting with algorithms to predict show up behavior or has already mechanism in place, we would be thrilled to connect them and see how we can improve your forecast.
As an example, our longstanding customer, Amsterdam Schiphol Airport has worked on a prediction model for show up profiles successfully. With our new interface and the usage of the detailed show up profiles in B Capacity we are now conducting validations to examine the improvement of the forecast.
If you want to know more about this topic or the outcome of the validation, please contact us.